DevTools
Chrome Extension · Free · No account

The development panel
that was missing
from Chrome

Inspector, SEO, Colors, Performance, Design, API Tester, Diagnostics and 40+ utilities in a side panel that stays visible while you browse.

✓ Free ✓ No account ✓ No telemetry ✓ PT · EN · ES ✓ Light and dark theme
5
Specialised panels
40+
Built-in utilities
8
Languages
0
Data collection
100%
Free
🔍 Tab: Inspector

Web Studio Inspector: side panel in action

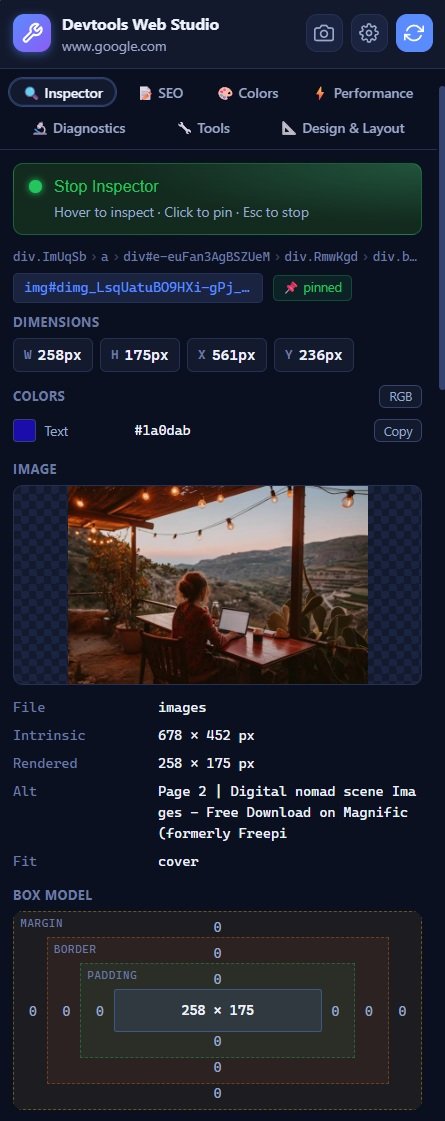
Inspect any element without opening the native DevTools. Click an element on the page and immediately see its styles, attributes and box model in the side panel.
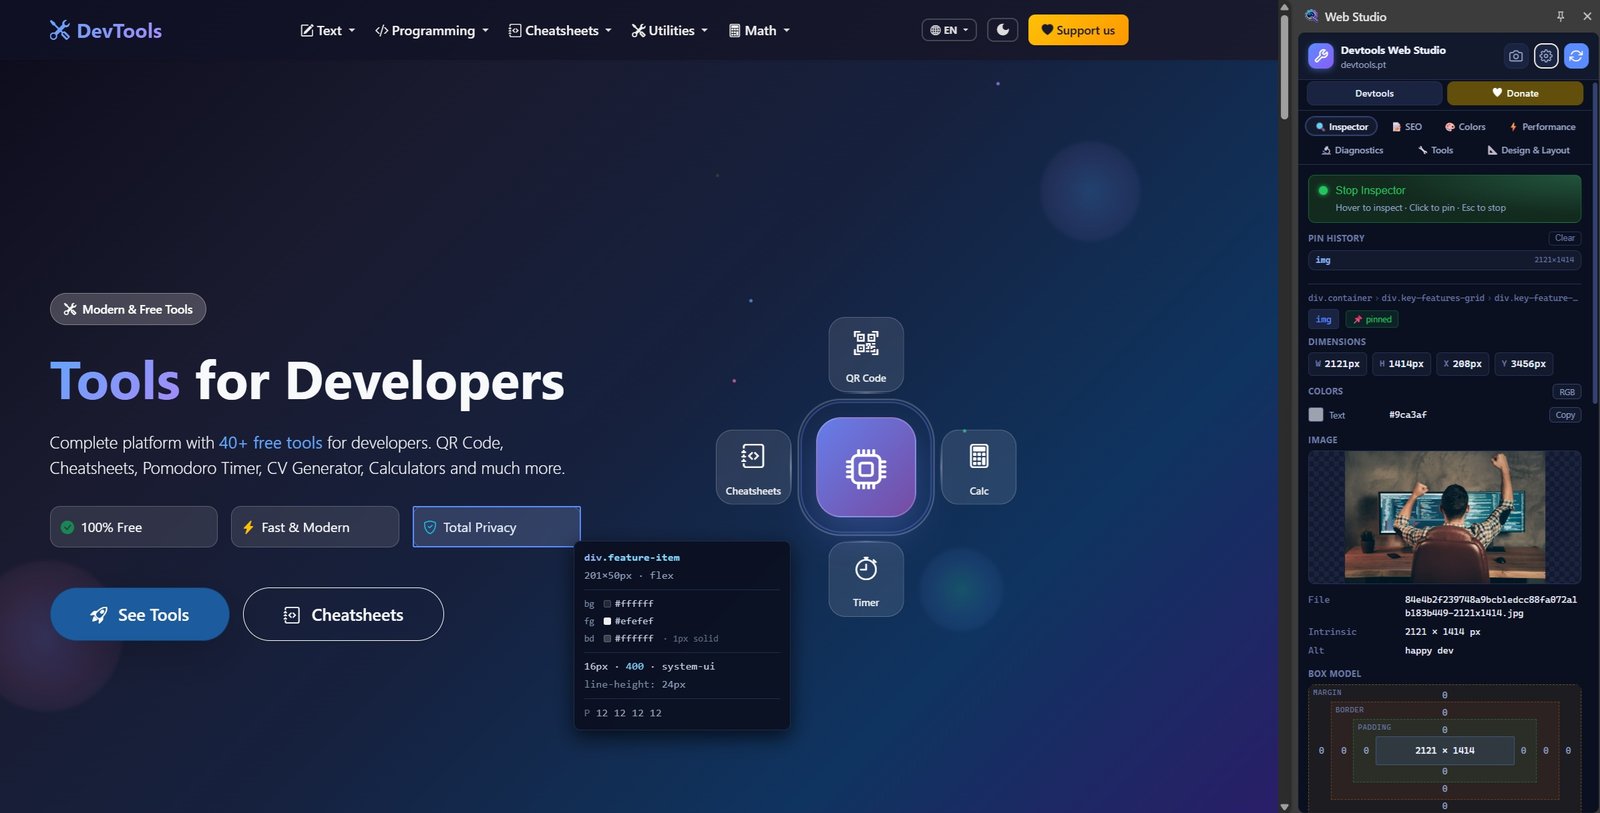
Web Studio Inspector: side panel in action
Inspector: styles, attributes and box model
Element Inspector
Styles, attributes and box model
Click any element on the page to inspect its computed CSS styles, HTML attributes and exact box model dimensions — all without opening Chrome's native DevTools.
  • Computed CSS styles of the selected element
  • HTML attributes and values in real time
  • Box model with margin, border, padding and content
  • Exact dimensions and position of the element
  • Navigate through parent and child elements
  • Copy the CSS selector or XPath of the element
Page Meta
Quick SEO check
Quickly access the essential meta information of the active page without having to open developer tools.
  • Title
  • Meta description
  • Canonical URL
  • Viewport
  • Charset
  • Language
Font Inspector
Identify fonts used on any element
Select any text element and immediately see the font family, size, weight and line-height applied.

Accessibility Audit: accessibility check
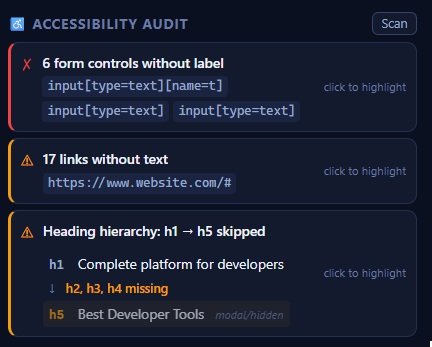
Accessibility Audit
Automatically audit page accessibility
Check the main accessibility issues on the active page according to WCAG guidelines.
  • Colour contrast
  • Alternative texts
  • Heading hierarchy
  • Form labels
  • ARIA
  • Links without anchor text
  • Language attributes
  • Tables without headers
  • Visible focus

Media Explorer: media browser
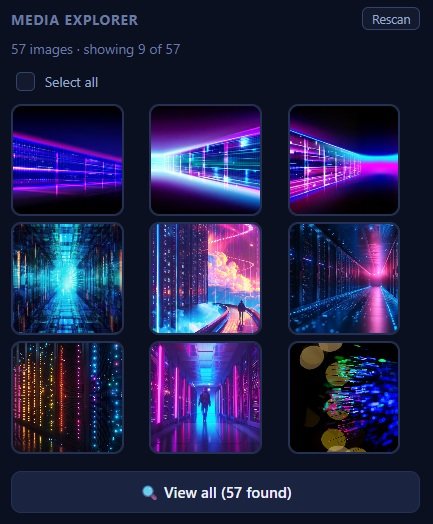
Media Explorer
Explore all media on the page
View and download all images, videos, audio and iframes on the active page in an organised panel.
  • Lists all images, videos and audio on the page
  • Filter by media type
  • Shows dimensions and file size
  • Open media directly in a new tab
  • Download any media directly from the panel
  • Copy the media URL to the clipboard
🎯 Tab: SEO

Complete SEO without leaving the page

Check meta tags, Open Graph, Twitter Card, canonical, robots and much more — directly in the side panel, without additional extensions.
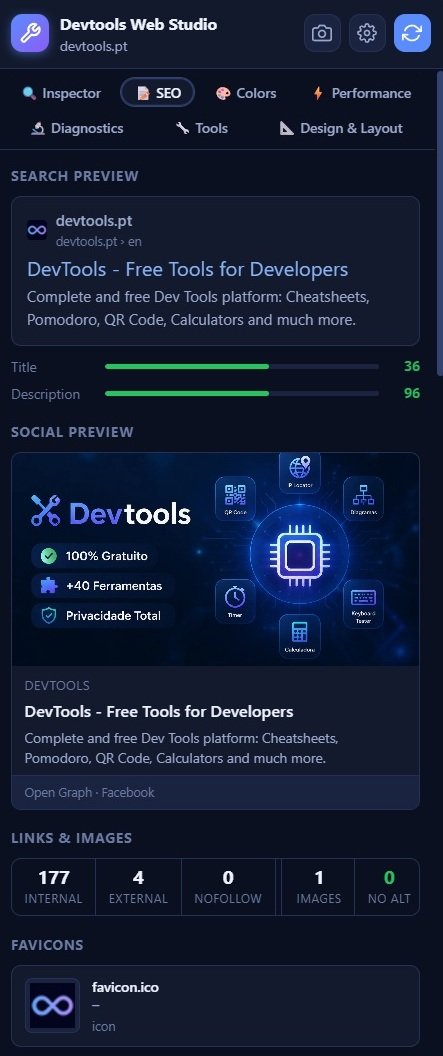
SEO Inspector: meta tags and on-page SEO check
🏷️
Title & Meta Description
Title, description and keywords with character and pixel limit checks.
📤
Open Graph (OG)
Social card preview with image, title, description and URL.
🐦
Twitter Card
Checks the Twitter card with all required and optional fields.
🔗
Canonical & Robots
Canonical URL, meta robots, X-Robots-Tag and indexation check.
📋
Schema.org
Detects and validates JSON-LD, Microdata and RDFa with required properties by type.
📑
Heading Map
Visual map of the H1–H6 hierarchy with detection of skips and empty headings.
🖼️
Images & Links
Lists images without ALT and links without anchor text for quick fixes.
🔄
Re-scan
Re-scans the page after content changes to update the results.
💡
Automatic scan on tab open. Click Re-scan after content changes to update results.
🎨 Tab: Colors

Colour format conversion

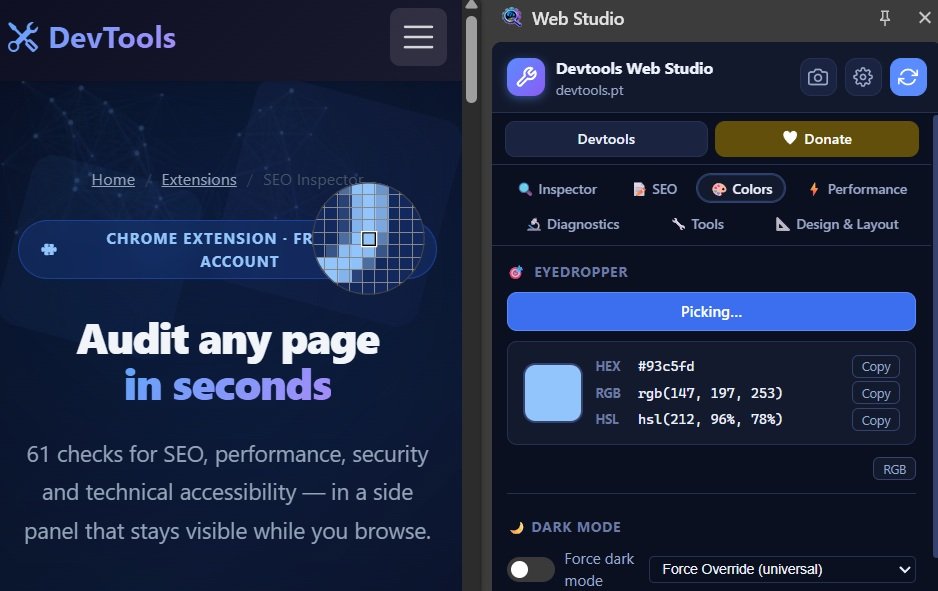
Convert, extract and check colours directly on the page. A built-in colour picker with instant conversion between all formats.

Color Picker
Colour picker with instant conversion
Choose any colour and automatically convert between HEX, RGB, HSL, OKLCH and other formats — with real-time preview.
  • Copy any format with one click
  • Real-time preview as you adjust values
  • History of most recent colours
  • Toggle between RGB and hexadecimal
  • Compatible with custom CSS variables
Color Picker: colour picker with instant conversion

Automatic page colour and contrast check
Page Colors
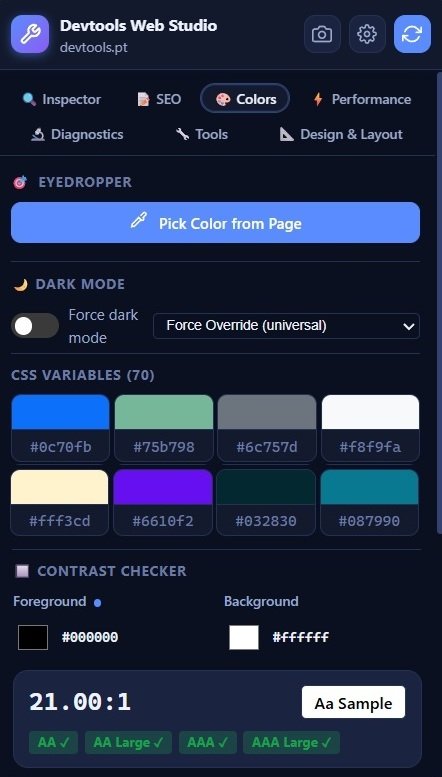
Automatic page colour and contrast check
Automatically extracts and checks all colours on the page, including CSS variables, and evaluates contrast according to WCAG standards.
  • Real-time preview as you adjust contrast values
  • Checks all colour variables on the site
  • Preview how the site would look with forced dark mode
  • Toggle between RGB and hexadecimal (#7c3aed → rgb(124, 58, 237))
  • Distinct dark mode modes: CSS Invert, selectors for Tailwind, Bootstrap or DaisyUI
  • Contrast report with WCAG AA and AAA rating
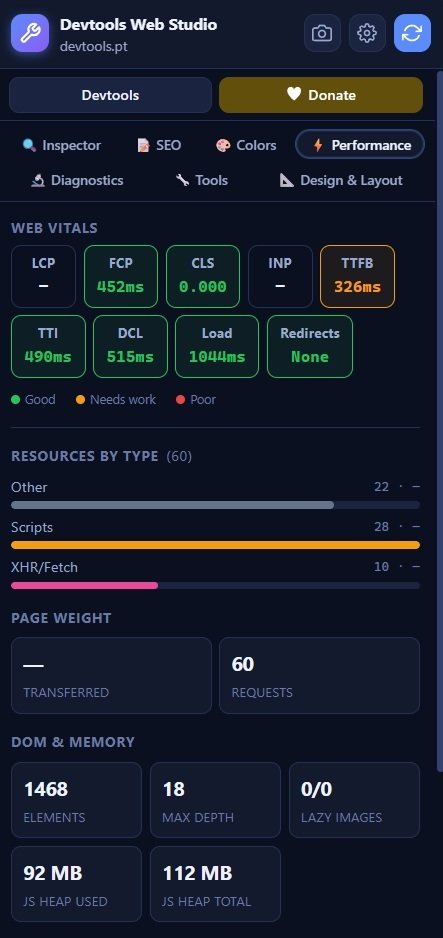
Performance: page loading audit
⚡ Tab: Performance

Audit page loading performance

Identifies resources that can be optimised to improve load time: prefetch, preconnect, lazy loading, compression and more.

🔌
DNS Prefetch
Detects missing hints for critical external domains.
Preconnect
Checks early TCP/TLS connections for third-party resources.
🖼️
Lazy Load
Lists images without loading="lazy" attribute that may slow down page load.
📦
Compression
Checks if text resources are compressed with gzip or brotli.
🔡
Font Display
Checks font-display to avoid FOIT and FOUT when loading fonts.
💡
Suggestions
Practical recommendations to improve the page's Core Web Vitals.
All metrics are measured directly from the browser's Performance API — no external servers.
📐 Tab: Design & Layout

Design Overlay and alignment tools

Check spacing, align elements with pixel-perfect precision and visualise the page structure differently.
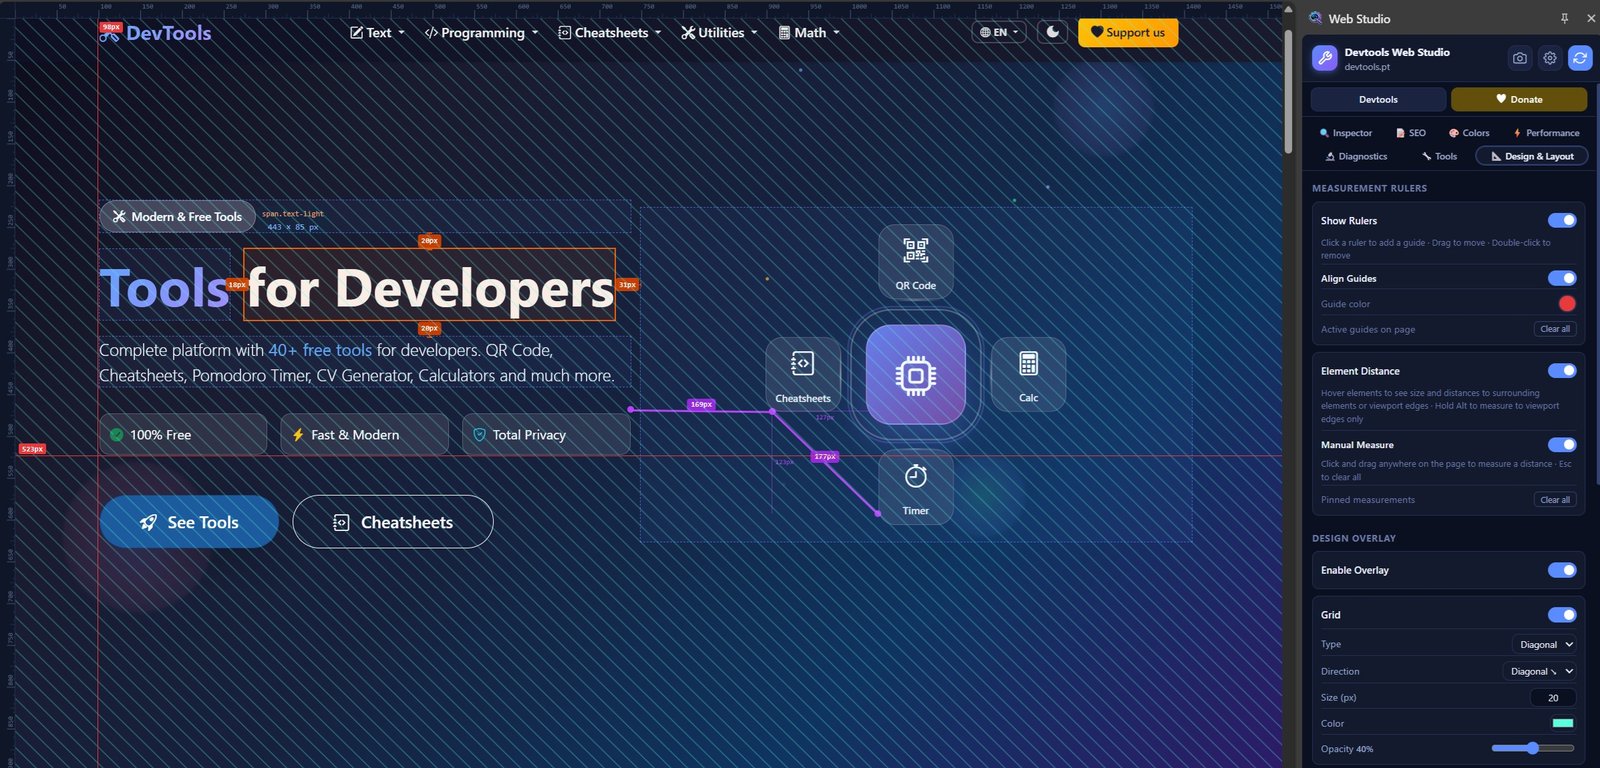
Rulers & Alignment
Align with pixel-perfect precision
Persistent rulers on the page edges, with position markers and alignment guides that stay visible while you browse.
Design & Layout: rulers and alignment tools
  • Persistent horizontal and vertical rulers
  • Draggable alignment guides
  • Element margin and padding highlight
  • Side-by-side comparison mode
  • Screenshot capture with annotations
  • Automatic snap to grid

Element Distance & Manual Measure: measuring distances
Element Distance & Manual Measure
Measure distances and element dimensions
Measure the distance between any two elements or points on the page with pixel precision.
  • Click two elements to measure the distance between them
  • Shows the distance in pixels and rem
  • Manual ruler mode for measuring custom areas
  • Export measurements for future reference
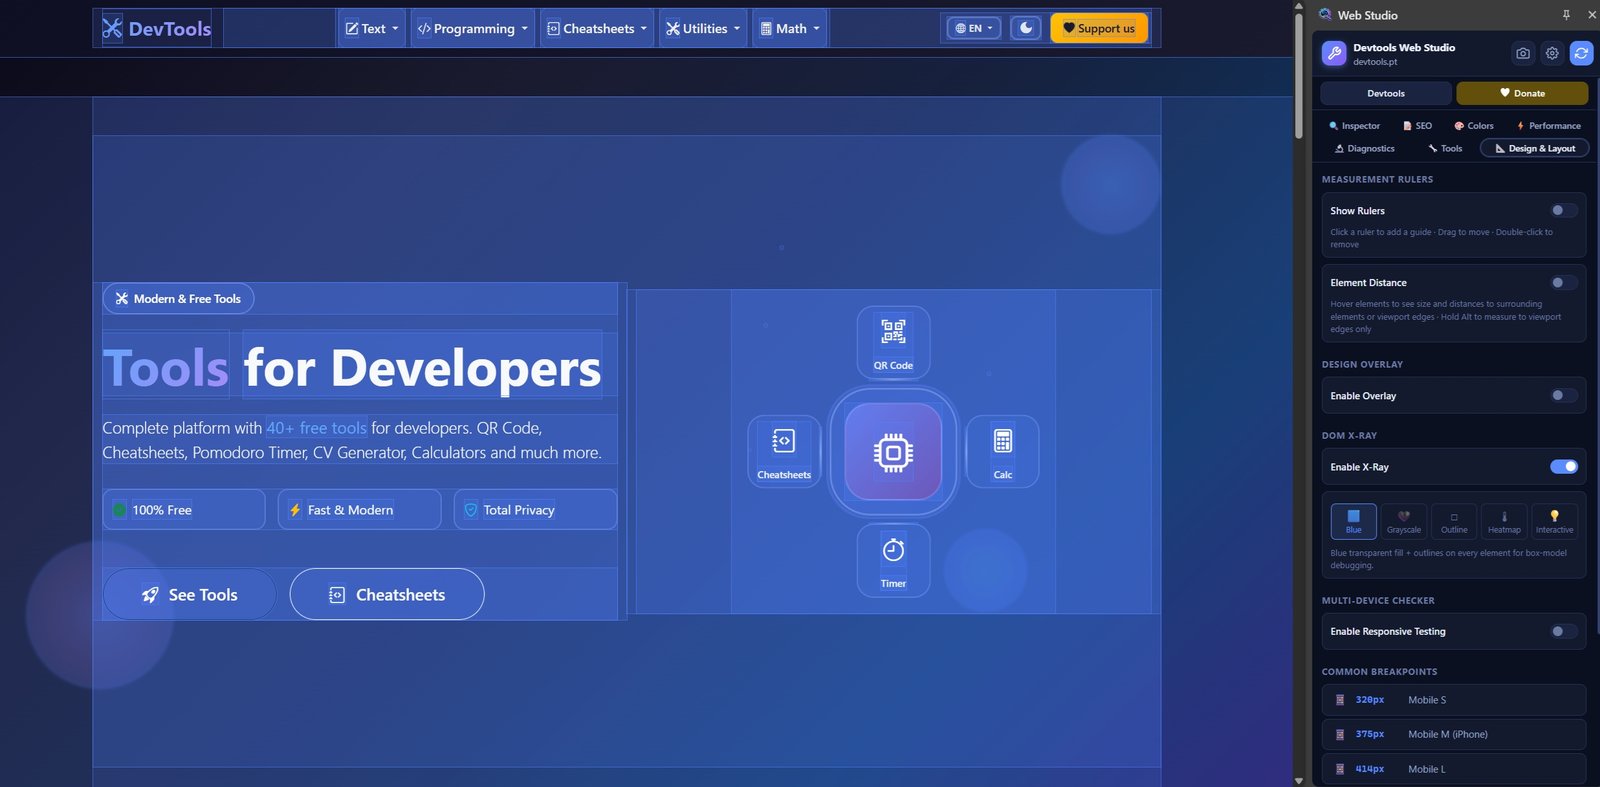
X-Ray Overlay: visualise page structure
X-Ray Overlay
Visualise the page structure differently
Enable different page visualisation modes to quickly identify layout and structure issues.
  • Blue Outline: Highlights all elements with a blue outline
  • Grayscale: Converts the page to greyscale
  • Box Outline: Shows box boundaries of all elements
  • Heatmap: Element density heatmap
  • Interactive: Highlights interactive (clickable) elements
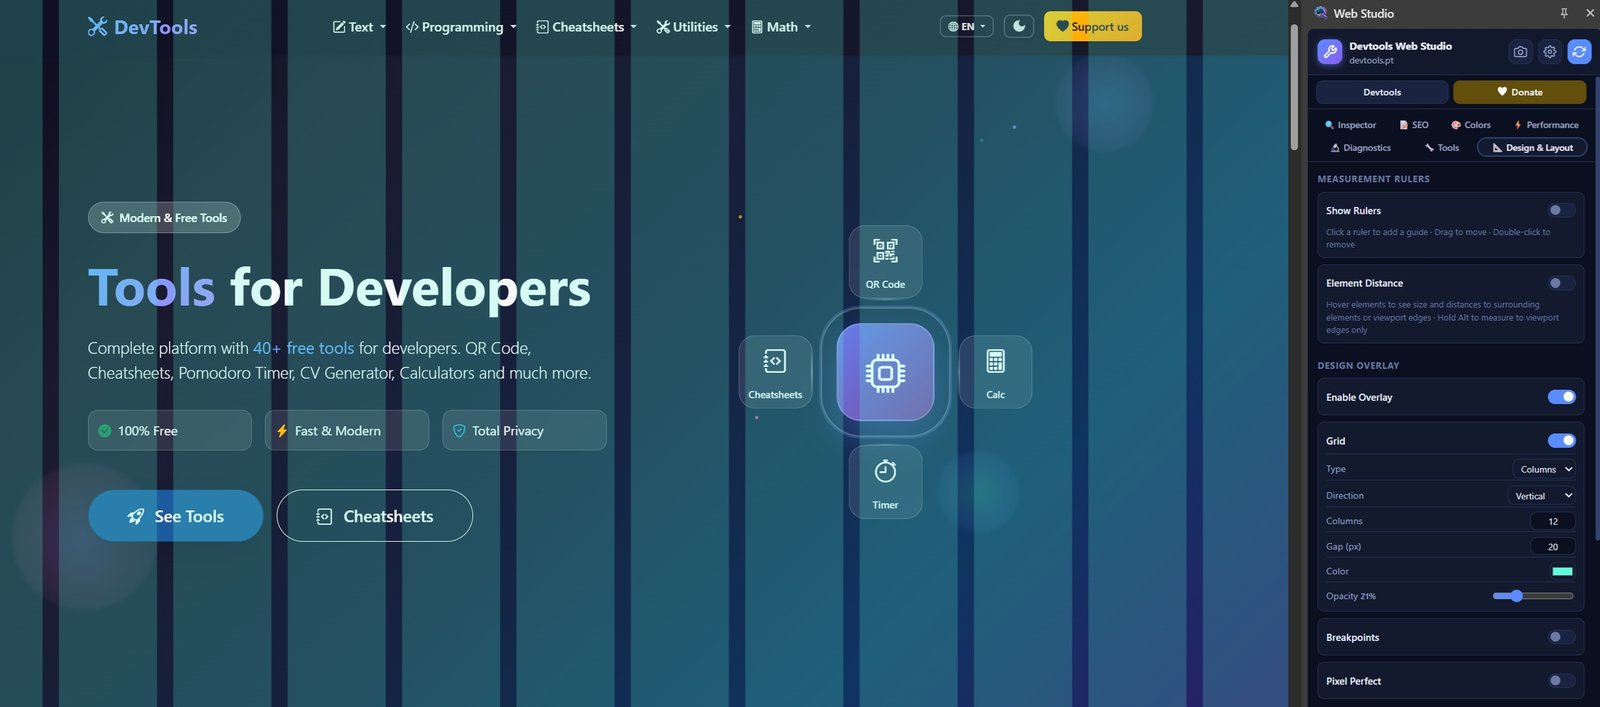
Grid, breakpoints and Pixel Perfect
Responsive & Grid
Grid, breakpoints and Pixel Perfect
Overlay a design grid on the page, visualise active breakpoints and compare the layout with the original mockup.
  • Grid Overlay: Custom grid with configurable columns, gutter and offset
  • Breakpoint Badge: Shows the active breakpoint in the page corner
  • Pixel Perfect: Overlay the original mockup for visual comparison
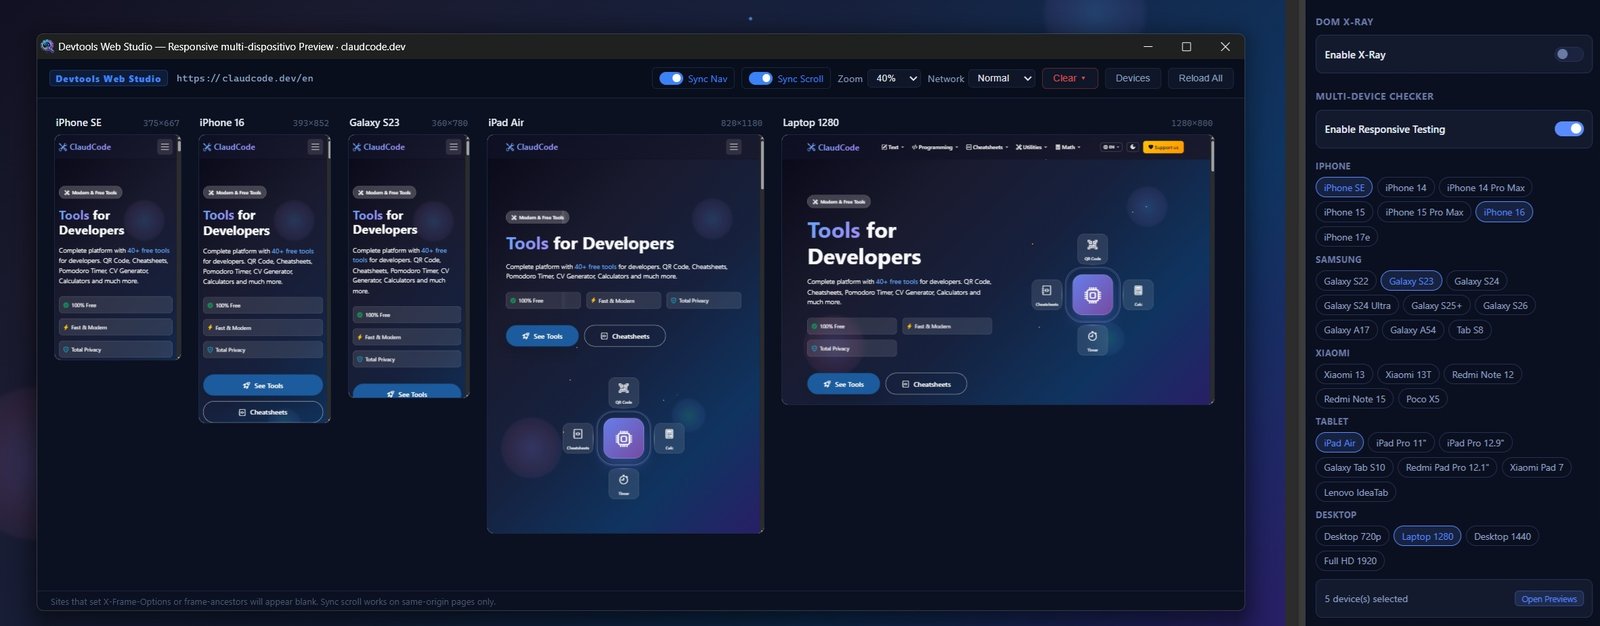
Multi-device Preview
View your site on multiple devices simultaneously
Simulate the site's appearance at multiple screen sizes at once — useful for checking responsive layouts without resizing the browser.
Multi-device Preview: view site on multiple devices
  • Mobile: 375px — iPhone SE
  • Mobile L: 425px — iPhone Plus
  • Tablet: 768px — iPad
  • Laptop: 1024px — Laptop HD
  • Desktop: 1440px — Full desktop
  • Throttle: Simulate slow internet: 2G, Slow 3G, Fast 3G or 4G
🚀 Tab: API Tester

Full REST client, in the side panel or window

Test REST APIs directly in the browser, without installing external tools. Supports all HTTP methods, headers, body and authentication.
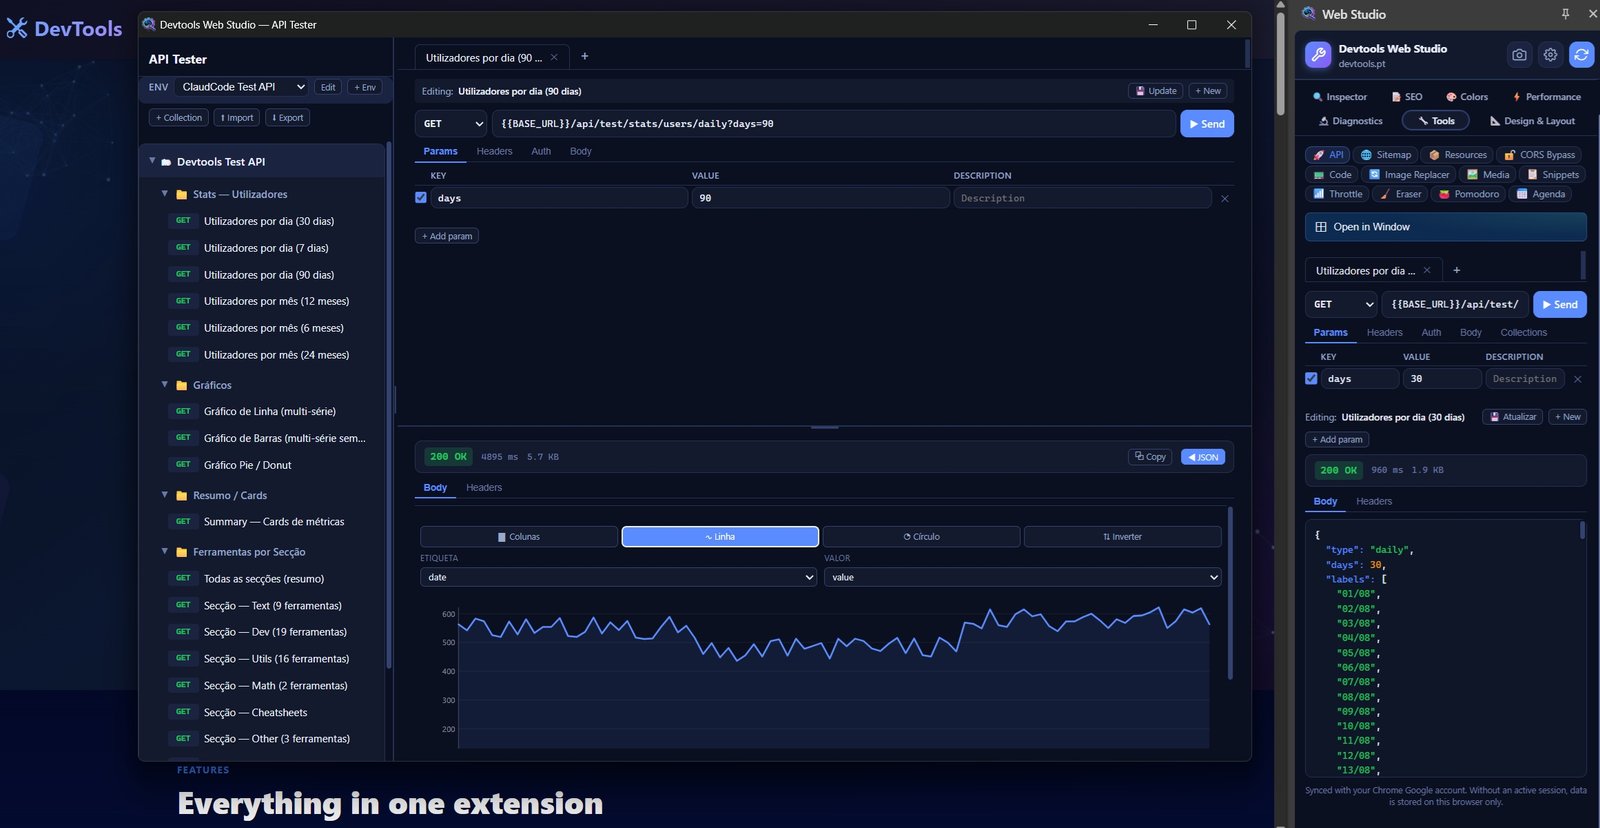
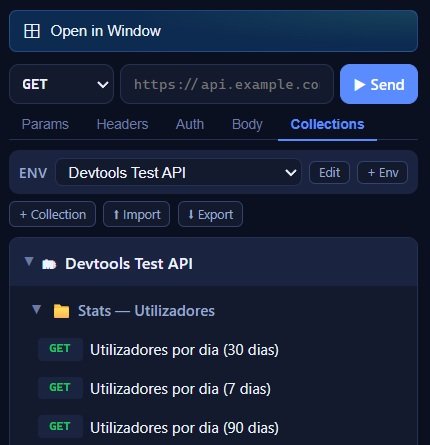
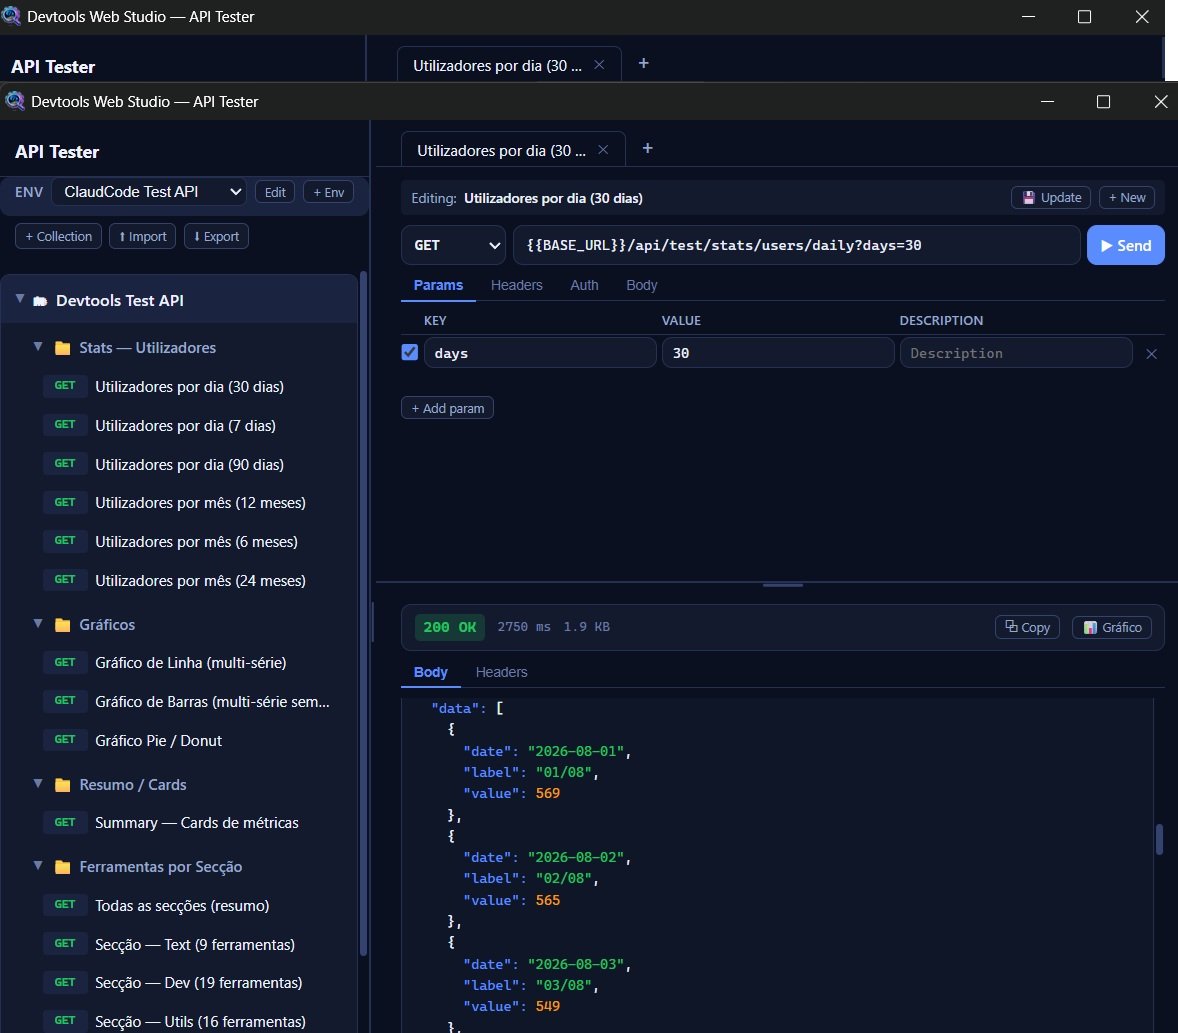
API Tester: REST client built into the browser
API Tester: collections, folders and requests
Organisation
Collections, folders and requests
Organise your API requests into collections and folders. Import Postman collections and save results for future reference.
  • Create collections and organise requests in folders
  • Import and export collections in Postman format
  • Duplicate requests with one click
  • Recent request history
  • Filter requests by method or name
  • Per-request or collection-inherited authentication
  • Easily edit project environments at any time
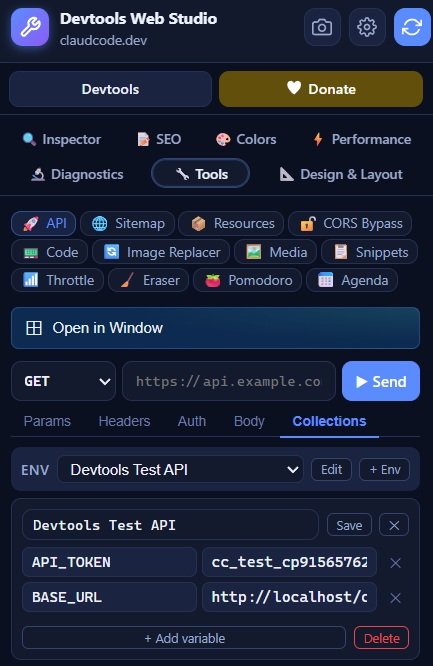
API Tester: environment variables
Environments
Variables per environment
Define variables for each environment (dev, staging, production) and switch between them without changing requests.
  • Reusable environment variables
  • Switch between environments with one click
  • Global variables shared across collections
  • Authentication: Inherit from collection
  • Authentication: Bearer Token
  • Authentication: Basic Auth
  • Authentication: API Key
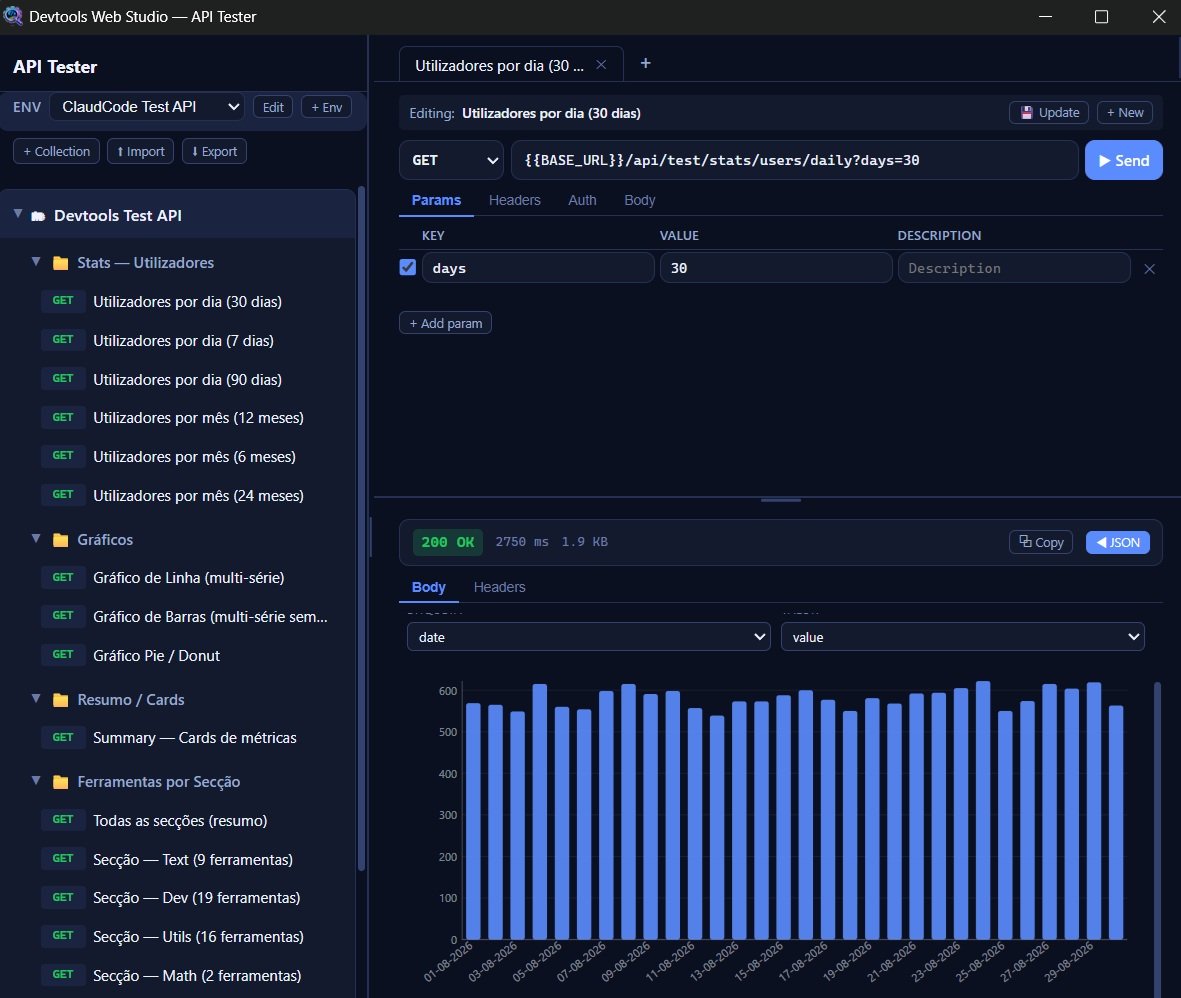
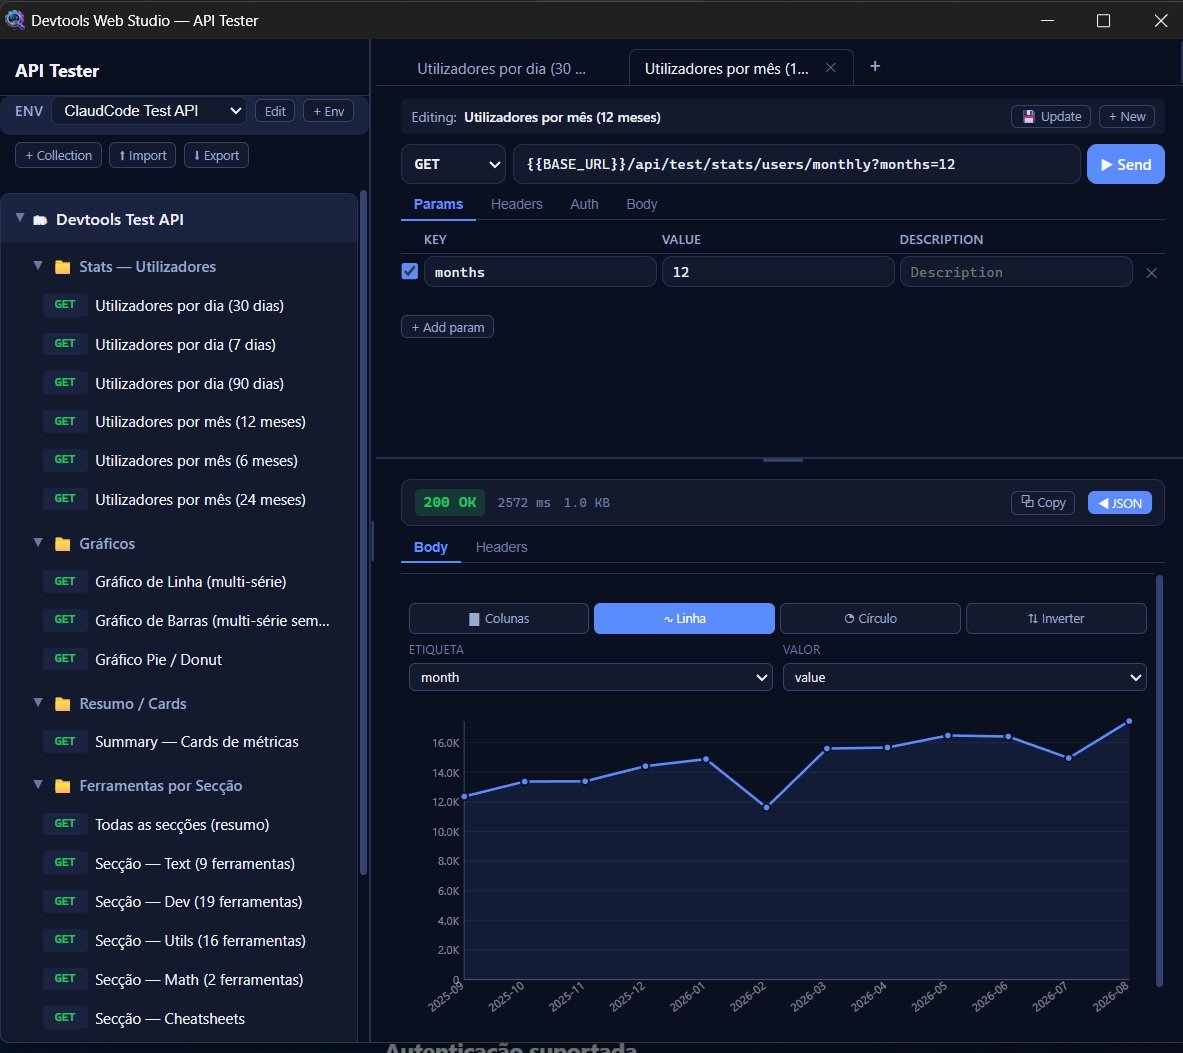
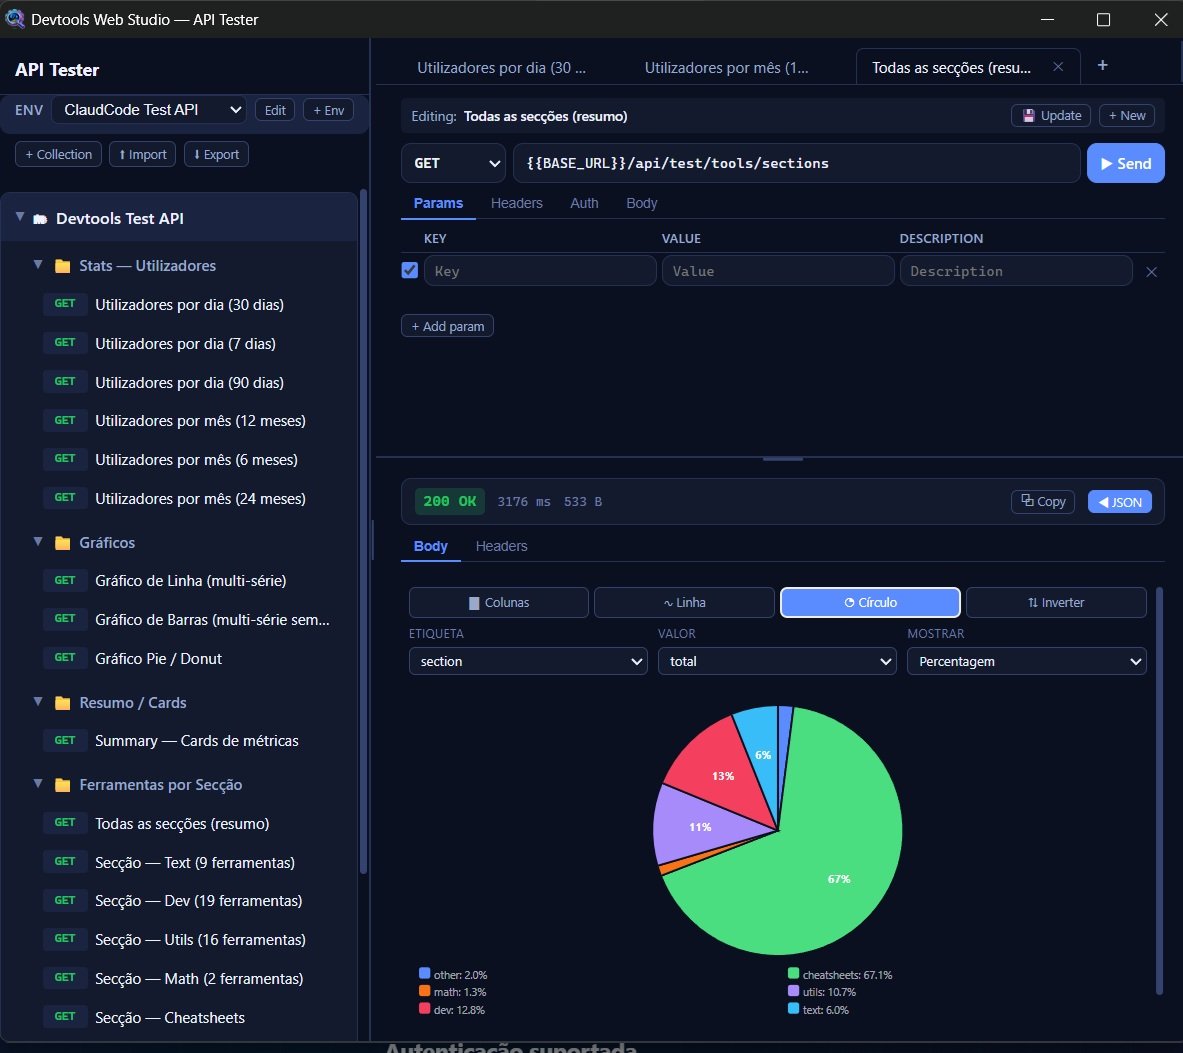
API Tester: JSON response API Tester: bar chart API Tester: line chart API Tester: pie chart
Response
Advanced response viewer
View the API response as formatted JSON, interactive table or chart. Ideal for APIs that return structured data.
  • Formatted JSON with syntax highlighting
  • Table view for arrays of objects
  • Bar chart for numeric data
  • Line chart for time series
  • Pie chart for value distribution
  • Status code, response time and size
  • Detailed response headers
  • Copy or export the full response

Supported authentication

🔑 Bearer Token
JWT or OAuth 2.0 token — automatically sent in the Authorization header.
👤 Basic Auth
Username and password — Base64 encoded and sent in the header.
🗝️ API Key
API key sent in the header or as a query string parameter.
🔗 Inherit from collection
The request automatically inherits the authentication defined in the collection.
💡
Compatible with the Postman collection format — import your existing requests without reconfiguring anything.
🔓
The built-in CORS Bypass lets you test APIs that block browser requests without any additional configuration.
🩺 Tab: Diagnostics

Complete real-time page diagnostics

Inspect HTTP headers, cookies, tech stack, JS errors and much more — all in real time, without reloading the page.
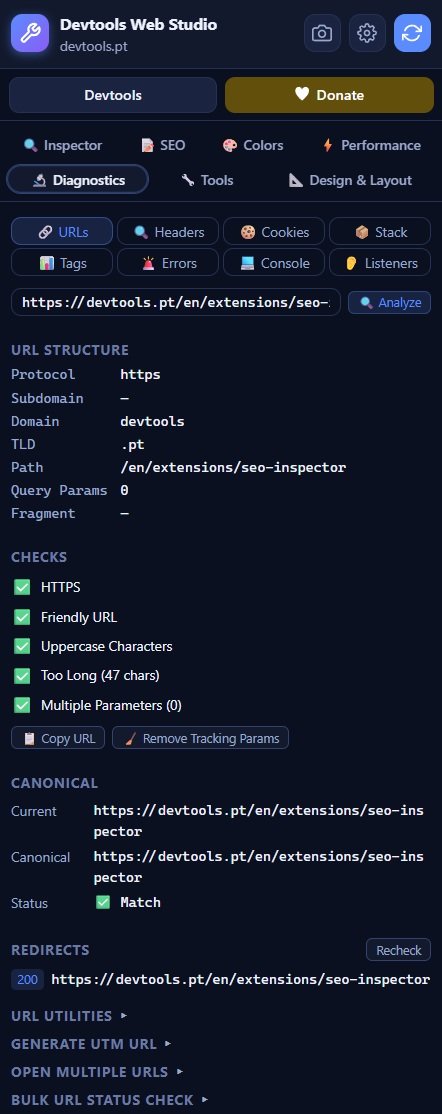
Diagnostics: HTTP headers, cookies and tech stack
🔗
URLs
Lists all URLs loaded by the page with status code and resource type.
🔍
HTTP Headers
Inspects all HTTP headers from requests and responses.
🍪
Cookies
Lists, filters and deletes cookies with all their attributes.
📦
Stack Detector
Automatically detects frameworks, CMS, analytics and other technologies.
📊
Analytics Tags
Identifies analytics and marketing scripts on the page.
🚨
JS Errors
Captures and lists JavaScript errors in real time while you browse.
Live opt-in
💻
Console
Records console.log messages in real time in the side panel.
Live opt-in
👂
Event Listeners
Lists all event listeners registered on page elements.

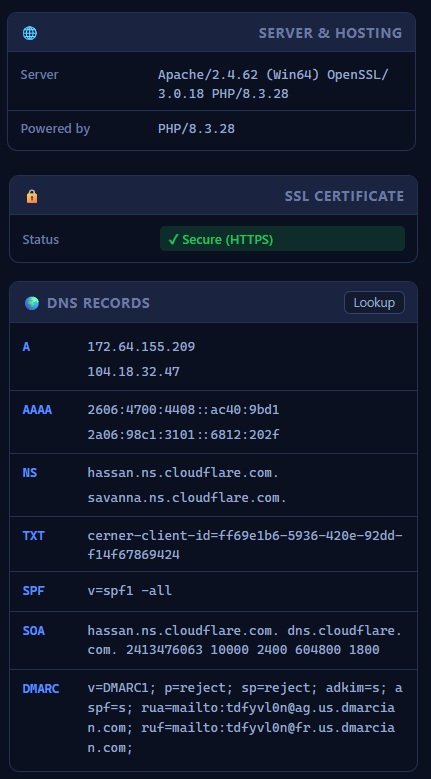
DNS: SSL certificate and DNS record diagnostics

Check the SSL certificate and 10 DNS record types

Query any domain via DNS over HTTPS directly in the browser — no external apps, no terminal.

A
Server IPv4 address
AAAA
Server IPv6 address
CNAME
Alias for another domain
NS
Authoritative name servers
MX
Mail servers
TXT
Text records (SPF, domain verification)
SOA
Start of Authority — administrative information
CAA
Permitted certificate authorities
SPF
Email sending policy (via TXT)
DMARC
Email authentication policy
ℹ️
JS Errors and Console records work in opt-in mode: enable them when needed and disable to avoid consuming unnecessary resources.
Utilities

40+ built-in utilities

Beyond the 8 main panels, Web Studio includes over 40 utilities for the day-to-day tasks of a web developer.
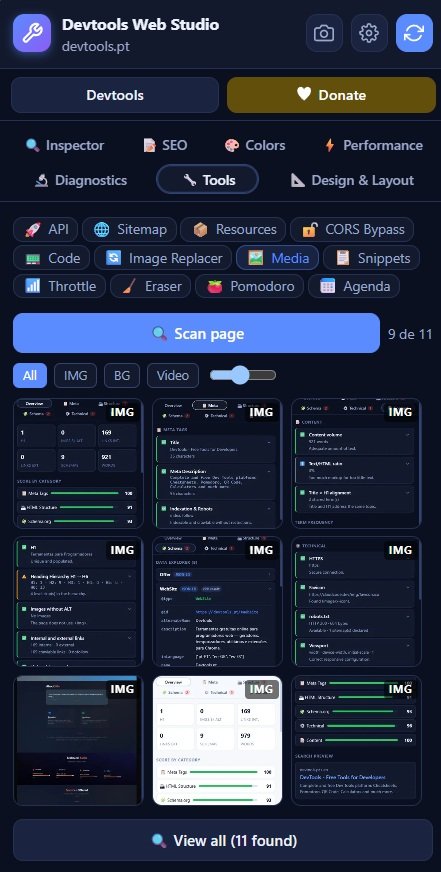
Tools: 40+ built-in utilities
📦
Resources
Lists all resources loaded by the page: scripts, styles, images and fonts.
📟
Code Formatter
Formats and validates HTML, CSS, JavaScript and JSON code directly in the panel.
🌐
Sitemap Viewer
View the current site's XML sitemap in a structured way.
📶
Network Throttle
Simulate slow connections: 2G, Slow 3G, Fast 3G or 4G to test loading.
🔄
Image Replacer
Replace page images with others to test layouts without changing the code.
🖼️
Media Downloader
Download all images and videos from the page with one click.
📋
Snippets
Save and run reusable JavaScript snippets on any page.
Todo
Built-in task list in the panel to note what to do while you develop.
🍅
Pomodoro
Built-in Pomodoro timer to manage focus and breaks during work.
🧹
Eraser
Temporarily remove page elements to see the layout without them.
🔓
CORS Bypass
Disable browser CORS restrictions to test APIs that block direct requests.
🖱️
Context Menu
Quickly access diagnostic tools by right-clicking any element.
Sync

Your preferences, on any computer

Web Studio automatically syncs your settings, API collections and snippets via Google Chrome Sync — no account creation, no password.

🧹
No additional setup
No account creation or additional app installation required.
💻
Multi-device
Your preferences are available on all computers where you use Chrome.
🔄
Automatic sync
Any settings changes are automatically synced via Google Chrome Sync.
📤
Export/Import
Export and import your API collections and settings manually.
🔒
Privacy
Sync is handled by Google's infrastructure. Web Studio does not access or store your data.
📵
Offline
All tools work without an internet connection — except DNS over HTTPS.

What is synced via Google Chrome Sync:

✓ Preferences and theme
✓ API collections
✓ Environments and variables
✓ Code snippets
✓ Colour settings
✓ Alignment guides
✓ Todo list
✓ Grid settings
Get started

Start in under 30 seconds

Install, open the side panel and start working. No setup, no account, no data collection.

1
Install in Chrome
Go to the Chrome Web Store, click "Add to Chrome" and confirm the installation.
2
Open the side panel
Click the Web Studio icon in the Chrome extensions bar to open the side panel.
3
Browse to any site
The panel stays visible while you browse — no need to reopen it for each page.
4
Choose the panel you need
Use the 8 tabs to switch between Inspector, SEO, Colors, Performance, Design, API Tester, Diagnostics and Utilities.
Privacy

Your data stays in your browser

Devtools Web Studio was built with privacy by default. We collect no data, have no servers and need no account.

📊 No data collection

✓ No data collected

Web Studio does not send any information to external servers. All operations happen locally in your browser.

💾 What is stored locally

Your preferences and collections are stored in Chrome storage — never on our servers.

  • Preferences: Theme, language and panel settings
  • API Collections: Saved requests, headers and environments
  • Snippets: Reusable JavaScript code
  • Todo list: Tasks stored locally
  • Grid & Guides: Saved design settings
  • Sync: Via Google Chrome Sync (optional)

🌐 External requests (opt-in)

Some features make requests to external services — always when you initiate the action:

  • DNS over HTTPS: DNS queries via dns.google (only when using the Diagnostics > DNS tab)
  • API Tester: requests are made by your browser to the endpoint you choose
  • SSL check: done locally through the Chrome API

Web Studio makes no background requests without your explicit action.

🔐 No tracking cookies

The extension does not use third-party cookies, tracking pixels, fingerprinting or any other identification technique.

🔓 Open and auditable code

The extension code can be inspected directly in Chrome at chrome://extensions → Details → Inspect views.

⚙️ Required permissions

Permission Purpose
sidePanel Show the Web Studio side panel
activeTab Access the active tab content for inspection
scripting Inject inspection scripts into pages
storage Save preferences and collections in the browser
contextMenus Right-click context menu
webRequest Monitor page network requests
declarativeNetRequest Implement CORS bypass declaratively
debugger Access the console and JS events in real time

Ready to start?

Install Devtools Web Studio

Free. No account. No data collection. One panel, everything you need.

Add to Chrome — Free